
Future facing commodities and China
All mined commodities are leveraged to global macro trends, and in particular, Chinese growth given the country consumes 40-50% of many of the world’s major commodities. Around the beginning of the decade, China emerged as a new major fast-growing source of demand. There was also a large-scale deployment of capital directed towards domestic building and infrastructure investment as well as the establishment of a low-cost export orientated manufacturing hub for the world. This structural change drove a positive demand shock and higher commodity prices, benefitting resources companies and their investors.
We draw two lessons that will endure as we move into the next phase of China’s evolution from an investment orientated economy to one that has a greater emphasis on consumption:
- Be Long what China is short. Be Short what China is long.
- The market size of the commodity matters.
Be Long what China is short. Be Short what China is long.
Australian investors have been on the right side of the above maxim. Australia produces at scale many of the commodities that China is short of, such as iron ore, metallurgical coal and LNG. Fortunately, Australia hasn’t been adversely impacted by the industries that China has disrupted, such as steel manufacturing and aluminium smelting. Further, resource ownership has largely been held by locally domiciled companies, in-turn creating significant value for Australian listed companies. We use the example of the Steel and Aluminium industries as case studies.
The rise of the Chinese steel industry represents the best example of the demand pull of China and its positive impact on Australian mining companies that produce iron ore. Over the past 20 years, Chinese steel demand grew 12% CAGR to 1 billion tonnes per annum. Over 50% of the world’s production of cheap capital, energy and labour inputs combined to form a large scale industry with a competitive advantage versus countries such as Australia where production fell by 2% CAGR to 5.3 million tonnes per annum over the same period. However, China has relied heavily on imports of steel making raw materials to help fuel this growth. Australia has capitalised on this structural demand growth given our significant endowment of high-quality ore, low extraction costs and close geographic proximity. Iron ore exports to China have increased 17% CAGR to 700 million tonnes since 2000. The country’s market share doubled from 30% to 60% during that time.
Figures 1 & 2: The rise of Chinese steel production and imports of Australian iron ore
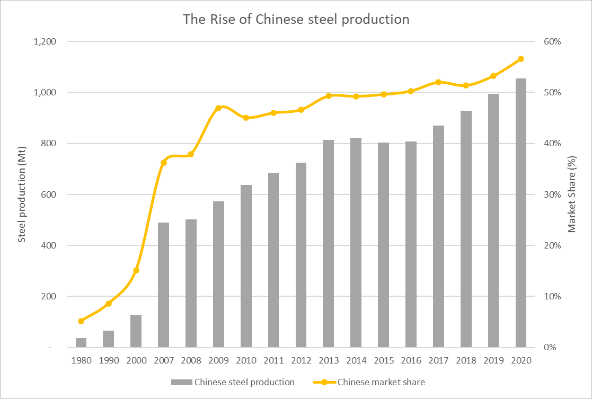
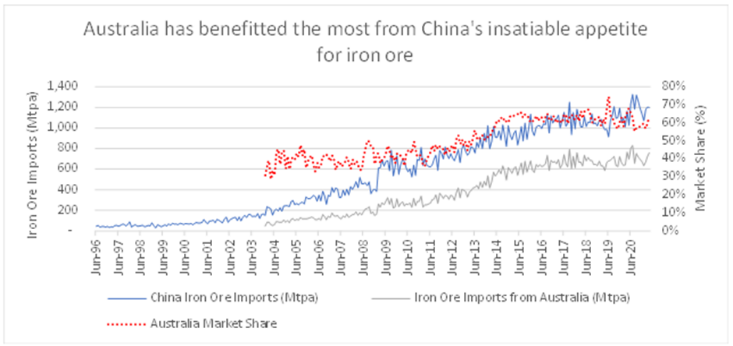
Source: WaveStone Capital, Bloomberg
In our view, the iron ore industry structure is incredibly attractive given that four companies control over 70% of the traded market and sit at the bottom left of the cost curve. This has allowed the incumbents to deliver returns in excess of 50% on their capital. Conversely, the less consolidated nature of global steel market (top 10 producers are 27% of production) and proximity on costs has resulted in return on capital at less than 10% for the downstream sector. Put in another way, out of every $1 of profit generated by the steel industry, on average 60% of this has accrued to the upstream sector over the past 20 years. Hence, our argument, ‘Be long what China is short’.
Figures 3 & 4: Iron Ore cost curve and steel EBITDA breakdown of steel
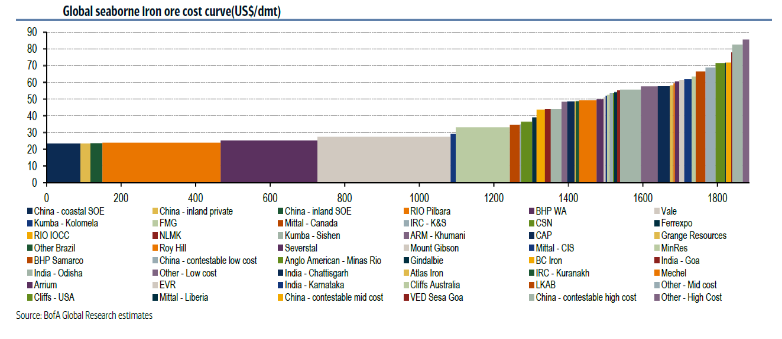
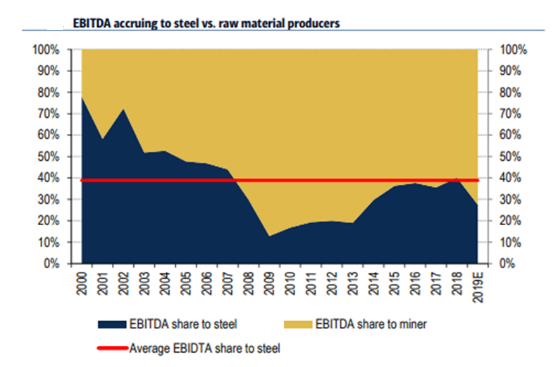
Source: Bank of America Research, World Steel Association, WaveStone Capital
Similar to steel, China has increasingly dominated the global production of aluminium, but in a similar vein has lacked critical raw materials to fuel its growth, such as bauxite. Australia, with a strong endowment of high-quality bauxite and low extraction costs, has grown exports but hasn’t been able to achieve the same level of growth as iron ore. Further, our refined products including intermediate products (alumina) and finished products (aluminium) have faced pressure. For context, we generate US$4b of sales in bauxite, US$6b for alumina and $4b in aluminium. In total, Australia derives $14b of total sales from an industry that generates around $200b in sales across its value chain globally. The main reason is that bauxite is the most abundant metal available on the planet and given the multitude of players in the industry, the industry structure is fragmented which impacts returns.
Figures 5 & 6: Chinese Aluminium production and monthly Bauxite imports by source
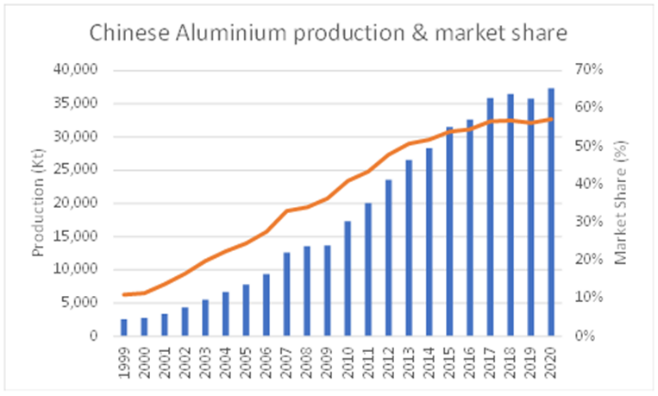
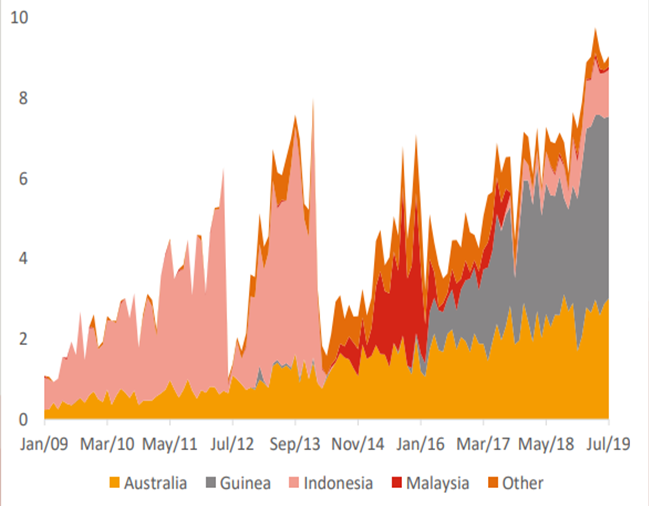
Source: Bloomberg, Wood Mackenzie, RBC and WaveStone Capital
Alumina and Aluminium: As we move into processing, Australia’s (and much of the Western world’s) competitive advantage begins to erode. Upstream resource extraction, particularly for bulk raw materials such as iron ore, coal and bauxite involves limited processing requirements so generally resource quality and quantity and industry concentration matter. In contrast, for value added processes such as in refining and smelting, the competitive advantage lies in low capital costs, cheap labour and electricity. Further, the proximity to end demand becomes more important given other indirect cost of production such as transport. We can see from the table below that China is best placed in this regard. In alumina the return on capital for Australian producers is around 12-14% and in aluminium it is under 5%.
Figure 7: Relevant cost breakdown of China versus the world
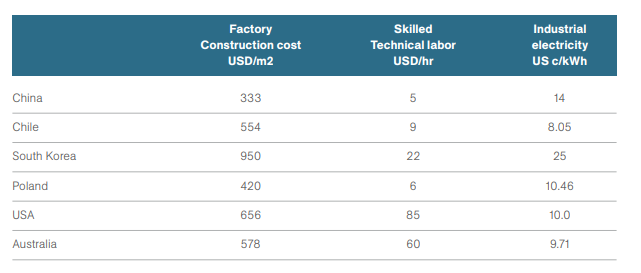
Sources: Turner and Townsend, OECD, National Renewable Energy Laboratory, CEIC, Korean Times. The above table does not take account of effective productivity.
Size matters
Our second observation is that even with a competitive advantage established, the size of a selected commodity matters for investors, given the opportunity to deploy capital and extract profits by those companies that operate in them. We consider this element to be vital as we enter the next phase of Chinese economic development.
The chart below shows the traded size of key commodities relative to Australia’s size. What is obvious is the size of the iron ore, gold and copper markets that are served by established players such as BHP, RIO Tinto and Newcrest. At the other end of the spectrum is Lithium at $4b, and rare earths (NdPr) at $2b. These are niche markets with more limited options to make money in aggregate terms and are also more exposed to decisions made by market participants. For example, the copper market is roughly 22mtp.a. in size and generates US$250b in annual revenue at today’s prices. BHP has recently deployed US$2.5b developing its new Spence Copper mine which has annual production of 185Kt p.a. of copper. This is equivalent to less than 1% of global copper demand but generates US$1.7b of revenue and US$900m of EBITDA for BHP. The same investment in Lithium Spodumene at present would deliver a capacity of roughly 400kt p.a. equivalent to 20% of current demand (in LCE terms) and destroy the market if deployed. From an investors perspective, assuming ($100/t iron ore and a 50% EBITDA margin for a tier 1 mining company and 6x EBITDA multiple, the available enterprise value for iron ore miners would be around US$500b, but only $12b for the Lithium sector.
Figures 8 & 9: Market cap of commodities
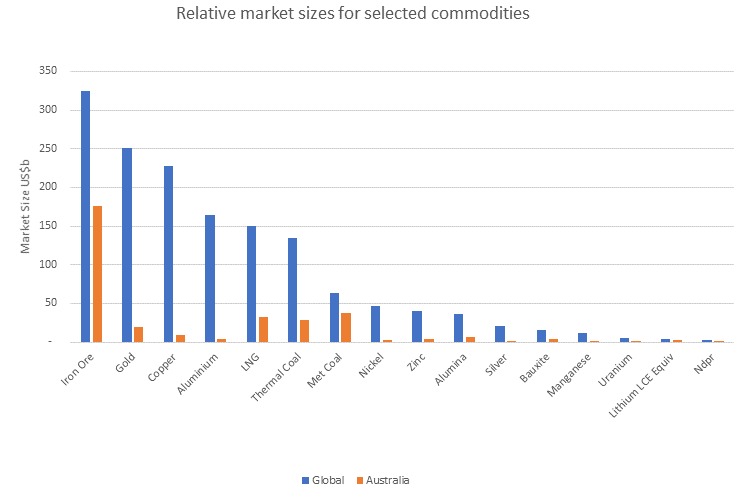
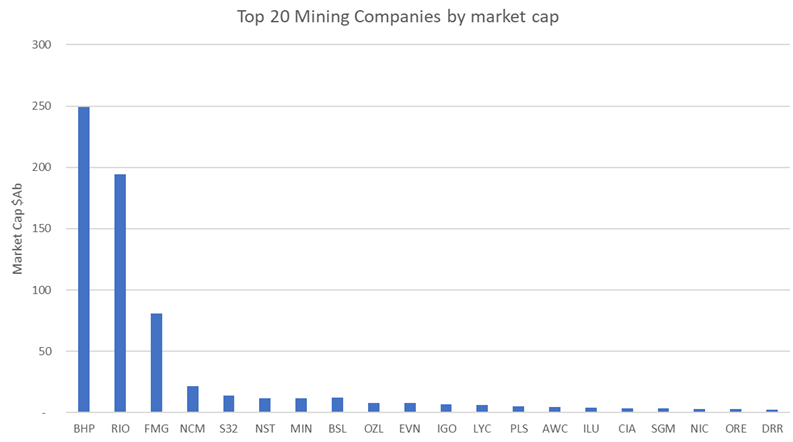
Source: WaveStone Capital, Bloomberg
Translating these themes into a growing Chinese consumer market
The status quo is changing, with the structural growth in Chinese steel production slowing as the Chinese construction sector matures. We examine the evolving shift to consumption and pivot towards decarbonisation of the products we consume. Both of these factors are beginning to play out simultaneously in China (and the rest of the world) and as they do, we will likely witness an anticipated demand shock for commodities such as copper, lithium, nickel, rare earths and graphite which are key ingredients for battery raw materials. Steel demand is likely to increase too given the metal intensive nature of renewables, but not to the extent of these other commodities. What will the size of this opportunity be? And who will capture the economic rent, upstream markets such as iron ore and copper, or downstream such as aluminium? How big of an influence does China have?
Consumption is a broad topic and involves many different sub-markets such as household appliances, technology, tiles and cars, which rely on key commodities in their supply chains. However, vehicle demand is the sub-market that is the likely to benefit from the above theme in aggregate and therefore impact commodity demand. In context, similar to other industries, China has increasingly dominated the worldwide manufacture of vehicle production growing by 13% CAGR over the past 20 years to 25.7million units in 2020, representing 32% of the global market.
Figure 10: Chinese vehicle production and global market share
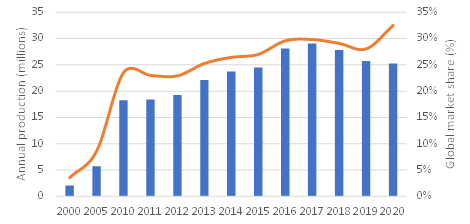
Source: WaveStone Capital, Bloomberg
Electric Vehicles and raw materials: a rapidly evolving sector
The expected growth in car sales in China is likely to continue at rates in excess of global growth alongside urbanisation rates and income growth. However, within this market, the drive-train of each car is in the process of transitioning from internal combustion engines (ICE) to electric vehicles (EV) alongside a global trend towards electrification in response to regulatory requirements, technology advances and consumer preferences. Recent research by UBS suggests that the uptake of EVs could equate to 50% of new car sales by 2030: that’s around 30m units per year globally from a small base in 2021. For China 15-20m of those annual sales are expected to be from Chinese consumers.
The key commodities utilised in the manufacture of EV’s are Lithium, Nickel, Graphite, Cobalt, Copper and Rare earths. If UBS forecasts come true, expected demand for these materials will be 11 times higher for Lithium and 1.5 times for copper from today’s levels to 2030 (on a cumulative basis). These changes would move the Lithium market (upstream and refining) to an equivalent status to that of base metals (circa $40-50b), provide strong support and growth within incumbent Nickel and Copper markets, while keeping rare earths’ status as a niche material intact.
Figures 11 & 12: EV penetration rate and commodity demand growth
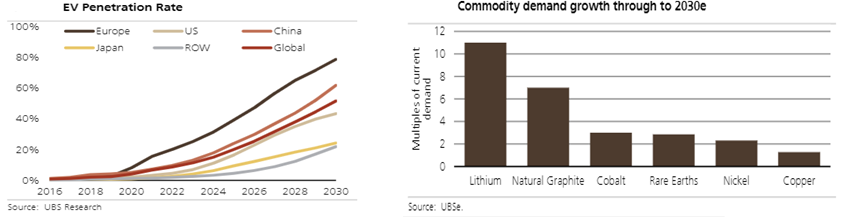
Source: UBS Research
Be long what China is short
While we are early in the development of the EV supply chain, we think the previous maxim again rings true.
China has arguably been a leader in establishing an integrated electric vehicle supply chain as they seek to satisfy their own demand and become a global leader in this field. In the upstream market, Chinese firms have developed their own capacity to the best of their ability and have encouraged new supply through equity investments in mines or long-term offtake agreements. In the downstream markets, a rapid build out of secondary and tertiary facilities has occurred. That said, with increasing trade-tensions emerging between China and the rest of the world other countries such as Japan and the USA are eagerly following in their footsteps and are also keen to set up alternative supply in order to establish more resilient supply chains in the future.
Turning our attention back to upstream markets, we already know that China relies on imports of Nickel and Copper to satisfy their own demand. We see a continued requirement for these in the future, with higher incentive prices required to encourage new supply from largely known sources such as Chile. While there is some endowment of lithium, the quantum is insufficient to fulfill expected future demand. Interestingly, rare-earth reserves are significant in China and they supply 80% of the world’s volume. However, for security reasons, (rare-earths are also used in weapons) the western world is seeking alternative forms of supply of this commodity also.
Outside of China, the largest publicly stated lithium reserves and production lie with Australia, Argentina and Chile. Ores and primary processing are extracted using traditional hard-rock (Australia) and evaporation means (Chile and Argentina). In Australia, the market is small and rapidly evolving given the emerging strong demand and likely pricing of upstream materials on an incentive level given the 11x expected demand increase by 2030 and the 2-3 year time period required to bring on new supply.
We make the following observations (1) there is a shape emerging which is largely driven by resource quality and quantity and (2) we are seeing a consolidated nature of ownership with a high level of Australian ownership from companies such as IGO Ltd, Pilbara Minerals, Mineral Resources, Orecobre and Wesfarmers. Several large global companies are also present including Tianqi, SQM and Albermarle.
Figure 13: Lithium production by country
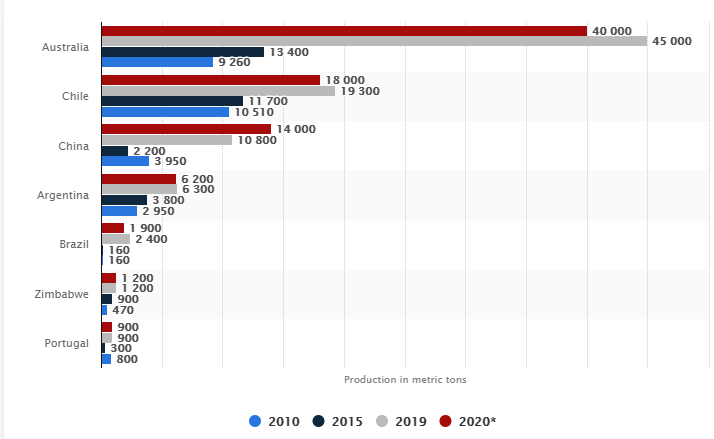
Figure 14: The upstream lithium cost curve
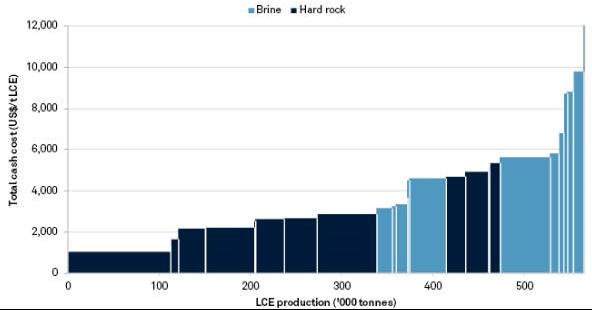
Source: WaveStone Capital, USGM, Company analysis, Platts
Still early days
In Australia, existing owners have plans to increase production materially in the coming years and we set these out below. Assuming an average capital cost of 600/t, this investment is around $4b in total in Australia alone for announced projects which are set out below. We expect several projects will likely be developed outside Australia including RIO Tinto’s Jadar integrated Lithium Hydroxide plant in Serbia and many Chinese state sponsored projects in the DRC, Zimbabwe and Mali which we are aware of.
In our view, Chinese involvement in the sector is driven by not only a wish to satisfy future demand, but also to avoid the industry concentration issues that have arisen in iron ore. By encouraging the oversupply of upstream raw materials, Chinese downstream sectors can enjoy an economic advantage through cheap feed costs.
Figure 15: Planned Australian spodumene capacity
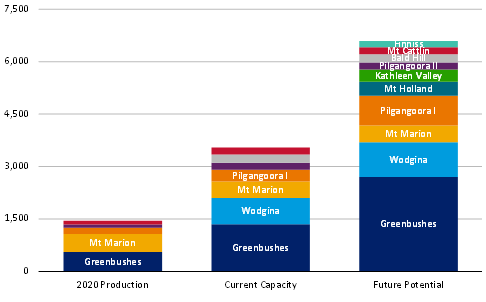
Source: Bank of America
Be short what China is Long
In midstream and downstream sectors, rapid expansion is also occurring in Australia. In our view, while it’s likely that China will continue to enjoy an economic advantage in steel and aluminium, we will also see upstream providers integrate into downstream compound manufacture such as hydroxide and carbonate. The reason is two-fold. We think hydroxide disadvantages can be offset to some extent by automation and low energy costs (particularly in Western Australia with its domestic gas reservation policy) and the growing concerns regarding security of supply that have come to light from trade protectionism and COVID-19 disruptions. Furthermore, integrated production will allow owners to respond to market cyclicality by limiting supply when they need to. However, the more we move downstream, this competitive advantage will disappear. Time will tell, given the young age of the fleet.
Figures 16 & 17: Competitive advantages for Australian producers remains upstream
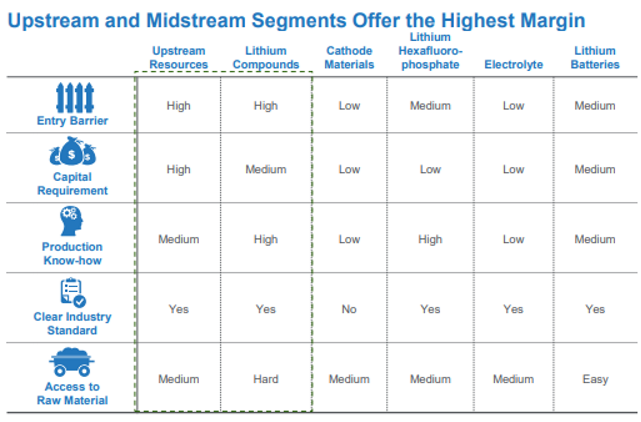
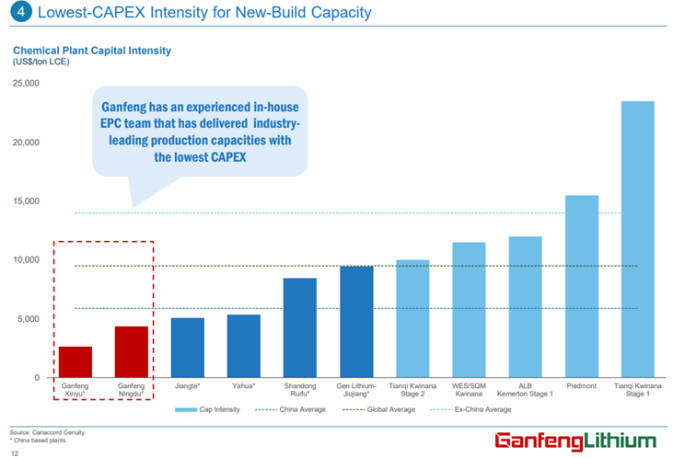
Source: Gangfeng Lithium
Summary
While its early days the shift to consumption over investment in China will provide opportunities for the resource sector in Australia and it’s likely that the best opportunities remain upstream. This is especially true for new materials such as Lithium and will maintain Copper and Nickel’s strong demand. That said, size matters and while the industry is likely to be significantly bigger than it is today is unlikely to rival the iron ore market.